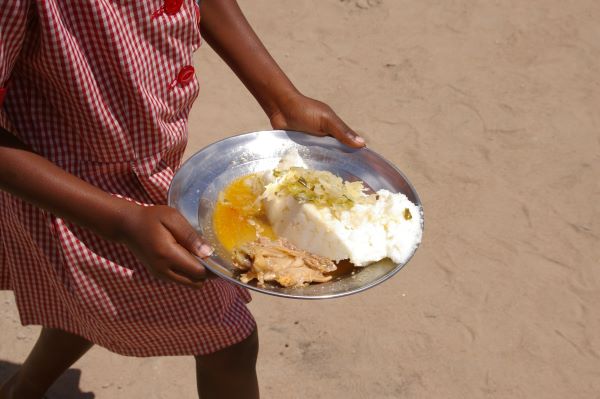
South Africa has enough food and numerous food programmes, yet millions of people still go to bed hungry. The HSRC recently completed a national food and nutrition security survey, which for the first time provides data that will help the government solve this problem through food security programmes targeted at district and municipal level. Thokozani Simelane and Antoinette Oosthuizen explain how researchers measured food and nutrition security and what they found. Indicators showed that levels and types of food insecurity varied between provinces and districts.

Photo: Erich.alder.herisau, Wikimedia Commons
Food and nutrition security is a constitutional right in South Africa, and the government views it as a core strategic priority. Numerous policies, strategies and programmes have been developed and implemented to ensure that people have enough nutritious food to eat. Support has included child support grants, school feeding schemes and farmer support programmes. Despite these interventions, and while South Africa is regarded as food secure at a national level, in some parts of the country some people still go to bed hungry or eat only once or twice a day.
Government departments need up-to-date data and scientific evidence at district and municipal level to ensure that their interventions are targeted. This is why the Department of Agriculture, Land Reform and Rural Development (DALRRD) commissioned the HSRC to conduct the National Food and Nutrition Security Survey (NFNSS) between 2021 and 2023.
HSRC fieldworkers visited more than 34 500 South African households in all nine provinces. They conducted interviews in local languages using questionnaires to ask people about the types and amounts of food they consumed and to gather household information on issues such as education, employment, and the effect of COVID-19 on their ability to access food. In some households children were measured and weighed to assess their health and growth.
Measuring food security is about much more than estimating volumes of food or regular access to it. People must also eat enough different types of food to stay healthy. So, to measure the different dimensions of food and nutrition security, the researchers used key internationally accepted food security indicators: the Household Food Insecurity Access Score (HFIAS), Household Hunger Score (HHS), Food Consumption Score (FCS), and Household Dietary Diversity Score (HDDS).
HFIAS and HHS reveal crisis areas
The Household Food Insecurity Access Score (HFIAS) measures the degree of food access challenges that a household experiences. Household members respond to nine questions about the frequency of certain behaviours that signify challenges in accessing food, and their responses are added to reach a score from 0 to 27. A household was regarded as ‘food secure’ if it scored 1 or less, ‘mildly food insecure’ if the score was 2 to 8, ‘moderately food insecure’ at 9 to 17, and ‘severely food insecure’ if the score was ≥ 18.
The survey revealed a national average HFIAS of 8.3 in South Africa; however, 17.5% of households scored 18 or more, indicating severe food insecurity. This means they often had to cut back on meal size or the number of meals consumed, and also experienced running out of food, going to bed hungry, or going a whole day and night without eating.
Another 26.7% of households were moderately food insecure, frequently consuming low-quality or undesirable food and occasionally reducing the size or number of meals. The mildly food insecure households (19.3%) worried about not having enough food and may have been unable to eat preferred foods, but rarely ate undesirable food and did not need to cut back. The food-secure households (36.5%) had access to food and rarely worried about not having enough.
The researchers also used the Household Hunger Score (HHS), which is derived from HFIAS questions and measures people’s experiences or perceptions of hunger. Nationally, over 79.2% of households reported that they experienced little to no hunger, while 15.3% experienced moderate hunger and 5.6% severe hunger.
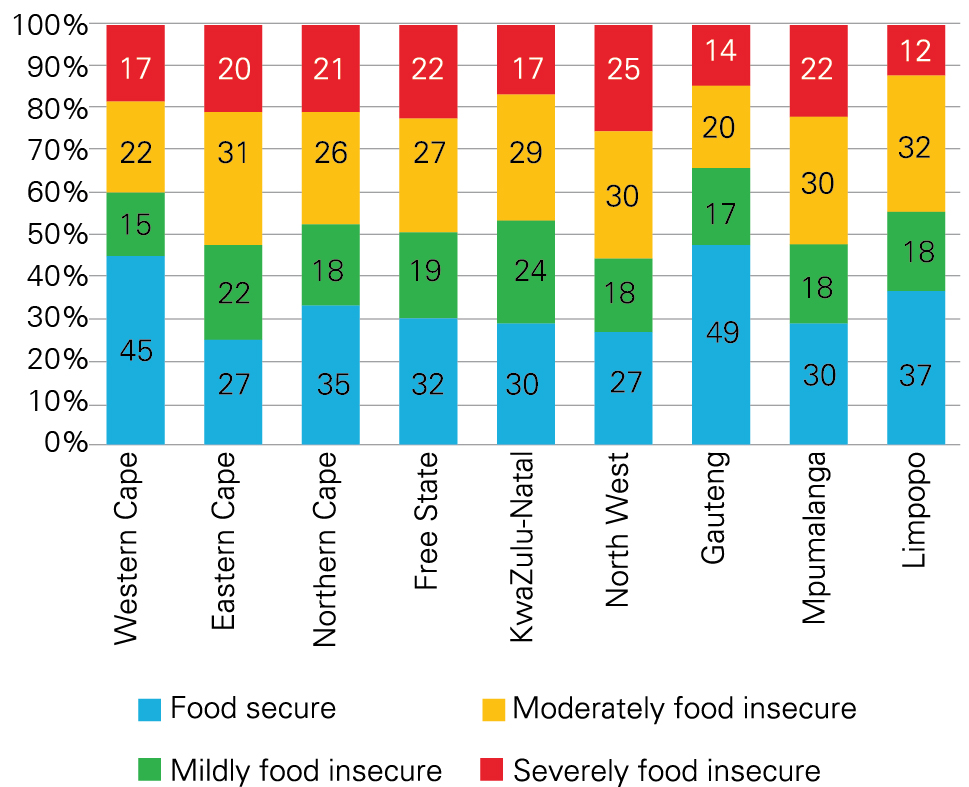
While the national HFIAS and HHS might have indicated that food insecurity in South Africa was not acute at a national level, provincial and district scores revealed crisis scenarios in some parts. In North West, the HFIAS showed that more than half of households were moderately (30%) or severely (25%) food insecure (Figure 1), while the HHS indicated that 10% of households experienced severe hunger, almost double the national HHS average.
Figure 1. Food security status disaggregated by provinces in South Africa (HFIAS)

Source: National Food and Nutrition Security Survey National Report (2023)
HDDS and FCS to measure dietary diversity
People must also eat from various food groups to stay healthy. A chronic lack of vitamins, minerals and other nutrients can lead to chronic diseases such as type 2 diabetes, cardiovascular disease and, among children, stunted growth.
This is why the researchers also used the Household Dietary Diversity Score (HDDS), constructed using the number of food groups reportedly consumed by the household over a 24-hour period. The food items were categorised into 12 different food groups, including different types of meat, vegetables, legumes and cereal, for example.
On average, findings show that households in South Africa consumed more than 6 out of 12 food groups, which suggests above-average dietary diversity levels, with 80.8% consuming highly diverse diets (≥ 6 food groups), 14.9% consuming medium dietary diversity (4–5 food groups), and 4.3% consuming low diverse diets (≤ 3 food groups).
The researchers also used the Food Consumption Score (FCS), which considers dietary diversity, food frequency and the relative nutritional importance of different food groups over a recall period of seven days. Food types are also weighted differently. A score can be ‘poor’ (0–21), ‘borderline’ (21.5–35), or ‘acceptable’ (> 35).
The findings showed that nationally less than two-thirds (58.1%) of the households consumed acceptable diets. About 23.3% of households were at the borderline and could fall into the category of consuming an ‘unacceptable diversity of foods’ if no actions were taken to help them improve their diets. Nationally, almost 18.6% of the households consumed poor diets.
The national overview of households indicated that most households survived on nutrient-poor food groups such as cereals, condiments, sugars, oils and fats. Consumption of nutrient-rich food groups such as fruits, pulses, nuts, eggs, fish, and seafood was limited.
The results showed significant variations between regions, districts and municipalities – again pointing to the dire need for targeted food programmes. For example, at provincial level, only 5% of households in KwaZulu-Natal had a poor FCS. However, looking at districts, 24% of households in uMkhanyakude scored poorly, as did 9% of households in the uMgungundlovu and iLembe districts.
Household characteristics and resources
Demographic and socioeconomic factors, such as gender, age of the household head, access to land and resources like irrigation, water sources, sanitation, and social grants, as well as factors such as household size, markets, household head’s education level, and involvement in agricultural production, were found to significantly influence the food security status of the households. For example, the findings indicated increased acute food insecurity in households headed by elderly people. Positive correlations existed between employment, higher education status, access to social amenities and improved status of household food security.
Measurement of children
The researchers measured children to establish rates of wasting (low weight-for-height), stunting (low height-for-age) and underweight (low weight-for-age), again identifying regions at risk. The national prevalence of overall stunting, wasting and underweight in children aged 0–5 years was 29%, 5.3% and 7.8%, respectively. However, in the Northern Cape, the overall prevalence of stunting was 48.3%, with 16% severely stunted. The province also had a severe wasting prevalence of 21.8% and severe underweight prevalence of 22.4%.
Recommendations
The NFNSS data can now be used to inform improved food programmes at regional and district level, and as a baseline to monitor household vulnerability to food insecurity. The report also provides South Africa with the opportunity to fulfil the requirements of the Dar Es Salaam Declaration on Agriculture and Food Security, a set of agricultural goals to help reduce food insecurity in the Southern African Developing Community region, to which South Africa is a signatory.
Specific recommendations include:
- Promotion of domestic food production encouraging families to produce their own food to ensure food security at household level
- Focused investment and establishment of agri-food processing centres to create an enabling environment for commercial food production and processing
- A focus on employment creation through a targeted agricultural sector employment-creation drive
- Investment in food markets and food banks at fruit and vegetable markets strategically located close to vulnerable households in all districts
- Land redistribution and restitution, with a rezoning strategy for land under traditional authorities so that some can be reserved for agricultural production
- Investment in post-harvest agricultural processing so the food system encourages and enables households to process and consume what they produce locally
- Protecting extremely poor households from seasonal hunger through assistance in particular months of the year (mostly January and June)
- Enhancing food safety by assisting informal traders and small businesses trading in agricultural products to improve the quality of their services and extend the lifespan of their products
- Improve household nutrition through continued interventions, such as breastfeeding promotion, growth monitoring of children, appropriate referrals, managing acute malnutrition, and dissemination of clear messages on the benefits of consuming nutrient-rich foods and dietary diversity, as well as guidance on food preparation and meal planning.
Author:
Prof. Thokozani Simelane, Principal Investigator, National Food and Nutrition Security Survey (NFNSS) at the HSRC and Professor of Practice, Faculty of Engineering and Built Environment, University of Johannesburg
Research team: Thokozani Simelane, Shingirirai Mutanga, Charles Hongoro, Whadi-ah Parker, Vuyo Mjimba, Khangelani Zuma, Richard Kajombo, Mjabuliseni Ngidi, Rodney Managa, Blessing Masamha, Tholang Mokhele, Mercy Ngungu, Sikhulumile Sinyolo, Fhulufhelo Tshililo, Nomcebo Ubisi, Felix Skhosana, Mavhungu Muthige, Natisha Dukhi, Ronel Sewpaul, Wilfred Lunga, Catherine Ndinda, Moses Sithole, Frederick Tshitangano, Aphiwe Mkhongi, Edmore Marinda, Kgabo Ramoroka, Joel Makhubela, Lesego Khumalo, Thabiso Tshetlho, Nhlanhla Sihlangu, Elsie Maritz, Katlego Setshedi, Masego Masenya, Busisiwe Mamba, Ngwako Lebeya, Awelani Nemathithi

