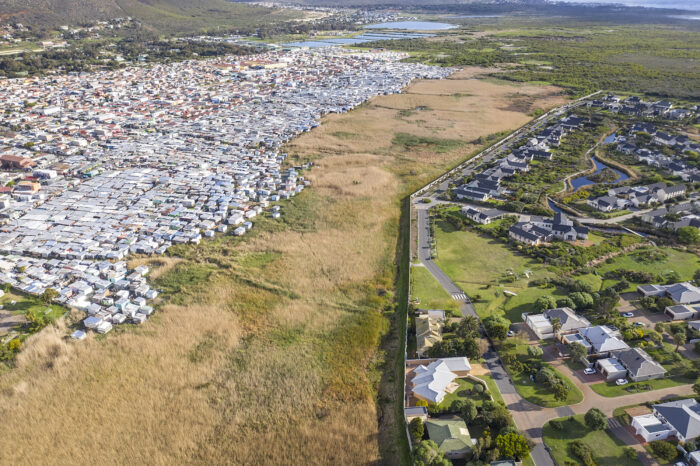
In Cape Town, the township of Masiphumelele borders Lake Michelle, a wealthy gated estate, two neighbourhoods that offer vastly different experiences and opportunities to their residents. Photo: Johnny Miller
Cape Town’s entrenched spatial divisions reflect its apartheid history and raise uncomfortable questions. Rising poverty-driven crime and people’s dissatisfaction with public services are huge problems in many neighbourhoods. They ultimately threaten the tranquillity of well-off enclaves, demanding stronger altruism, solidarity and resource prioritisation for marginalised communities. This is according to a recent report by Ivan Turok, Justin Visagie and Andreas Scheba. Based on findings from a household survey, it highlights stark contrasts between five types of neighbourhoods in the city.
The hazards and opportunities that people experience in their home neighbourhoods determine their future health, education, economic prospects and general wellbeing. In South Africa, persistent inequality is reflected in stark contrasts between neighbourhoods, which is why HSRC experts are looking at city spaces and housing to find ways of improving living conditions.
During 2021–22, in the wake of the COVID-19 pandemic, the HSRC conducted a household survey of about 1,000 residents from different parts of Cape Town. Neighbourhood Matters in Cape Town, a report by Ivan Turok, Justin Visagie and Andreas Scheba, was part of a four-year study of neighbourhood patterns and dynamics in seven countries and 14 cities around the world. The HSRC did this work as part of an international research consortium, the Global Challenges Research Fund’s (GCRF) Centre for Sustainable, Healthy and Learning Cities and Neighbourhoods (SHLC).
The Cape Town survey described the following five most significant neighbourhood types and conducted telephonic and in-person interviews with about 200 residents from each of these.
Highest income: The leafy suburbs
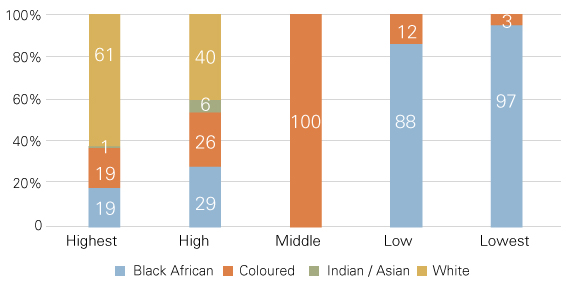
The highest income group included mostly professionals who lived in low-density, free-standing houses, the so-called “leafy suburbs”. About 60% were white, more than two-thirds owned their properties, and most were employed in the formal sector (59%) or ran their own businesses with some employees. Only 7% were unemployed, the lowest of all neighbourhoods.
High income: Apartment blocks and the precinct
Middle- to high-income earners lived in higher-density precincts made up of apartment blocks close to transport routes. Almost 40% rented their accommodation and about 40% were white. Most (60%) worked in the formal sector, with 11% informally employed and 20% self-employed. At 24%, the unemployment rate was double that of the wealthy cluster but still significantly lower than in other neighbourhood types.
Middle income: Coloured communities
These neighbourhoods were home to mostly Afrikaans-speaking, coloured residents. Many lived in semi-detached houses (32%) and flats (14%), and the average households were 3.9 times larger than those of other neighbourhood types. The unemployment rate was 45.4%, the highest of all clusters. However, these residents had more assets such as cars, washing machines and internet connectivity than other poorer groups. This may be because almost three-quarters of those who were employed, worked in the formal sector, which tends to be better[AO1] paid than informal work.
Low income: Townships
Low-income townships were home to mostly black African (88%) and coloured (12%) residents. Some township houses were built during apartheid to entrench racial segregation, but many others were developed as part of massive post-apartheid housing programmes. This explains the high levels of home ownership (62%) despite low incomes and 40.5% unemployment.
Lowest income: Informal settlements
The lowest-income neighbourhoods were informal settlements, with 30% of residents living in makeshift dwellings that were connected to electricity. More than 23% rented from private landlords. The population of these neighbourhoods were almost exclusively black African (97%), with a 43.5% unemployment rate.
Figure 1. Racial composition of the surveyed neighbourhoods in Cape Town
Source: HSRC
Access to services
Almost 40% of the residents in the poorest neighbourhoods accessed water outside their properties – for example at communal taps – and 36% relied on communal shared toilets. ‘This is a serious concern in terms of human dignity and the risks for personal safety and security,’ the report reads. Most neighbourhoods surveyed (93–95%) had access to electricity, but the researchers point out that many low-income households accessed electricity through informal (and unauthorised) connections, which are often unsafe and unreliable. The survey did not cover informal settlements that had not been electrified.
Health
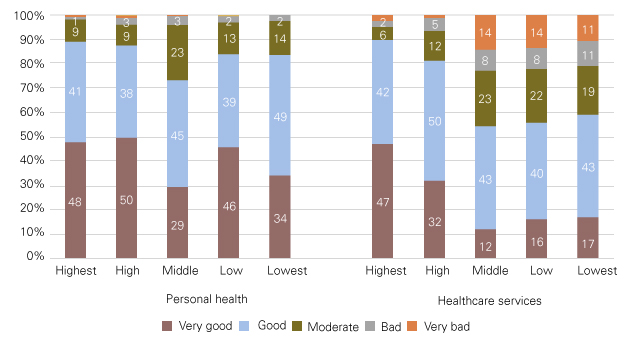
Most of the residents rated their personal health and happiness as good or very good. However, while 90% of residents in the highest-income areas rated their healthcare services as good or very good, less than 60% of those in middle- and lower-income areas did so. In fact, more than 20% of those living in the poorer areas described these services as bad or very bad.
Figure 2. Rating of personal health and healthcare services
Source: HSRC
Education
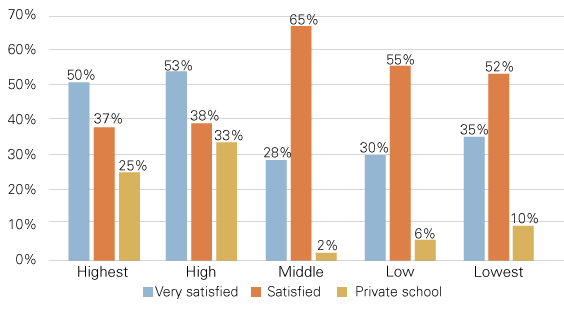
Most residents were satisfied or very satisfied with their schools, which the researchers found surprising considering the marked contrasts in school quality across Cape Town neighbourhoods. Private schools were important in the high- and highest-income areas, attended by approximately 33% and 25% of children respectively (Figure 3). The researchers believe this may have contributed to the higher levels of online learning in those areas during the COVID-19 pandemic. More than 75% and 82% of respondents from the highest- and high-income neighbourhoods had access to online learning in their households, compared with only 36% and 45% for the middle- and lower-income neighbourhoods.
Figure 3. Satisfaction with schooling
Source: HSRC
Neighbourhood experiences and attachment
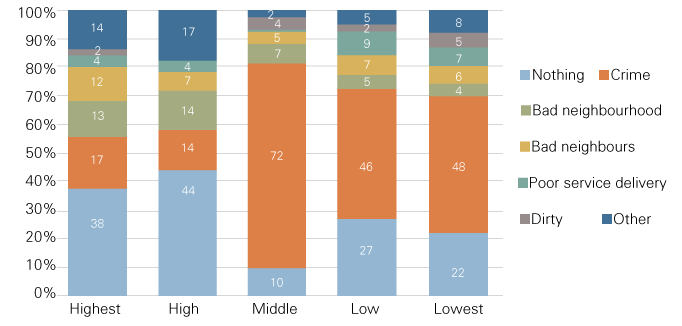
Crime was the biggest neighbourhood concern. However, only 14% and 17% of residents in the high- and highest-income neighbourhoods shared this concern, compared with 72% in middle-income areas and 46% to 48% in low-income areas (Figure 4).
The researchers point out that Cape Town’s townships experience among the highest levels of violent crime in the country, including gender-based violence, drug dealing, gangsterism, vigilantism and murder. Challenges include staff shortages and a lack of visible policing in informal settlements. Other concerns paled in comparison, with a minority anxious about other aspects of their neighbourhoods, their neighbours or poor service delivery.
Figure 4. What do you dislike about your neighbourhood?
Source: HSRC
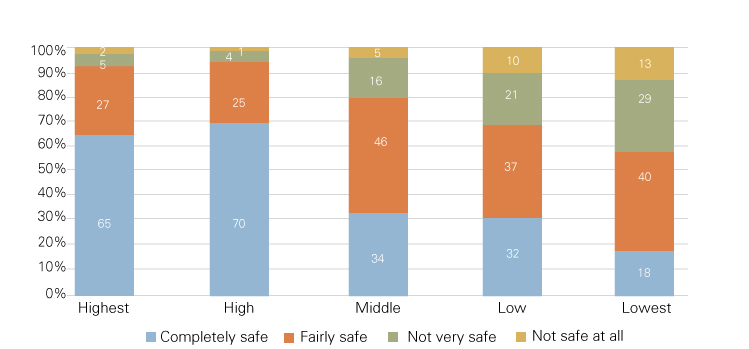
Respondents from the poorest communities were also far more likely to feel vulnerable in their own homes (42%) than those from high-income neighbourhoods (8%). See Figure 5. They also felt less attachment to their neighbourhoods, were less likely to trust their neighbours and were less likely to believe that they had the power to change things in their neighbourhoods.
Figure 5. How safe do you feel inside your own dwelling?
Source: HSRC
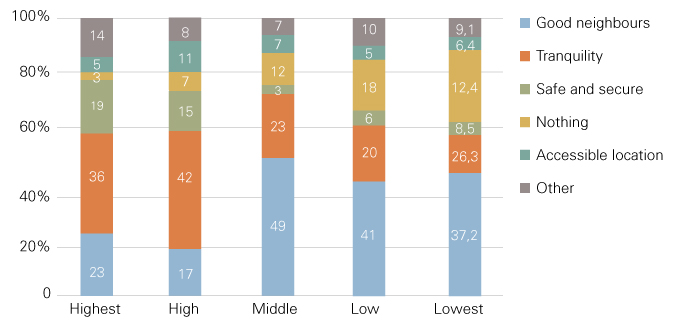
Only a third of the Capetonians interviewed valued their neighbours highly, but residents from low- and middle-income areas appreciated their neighbours more than those in high-income neighbourhoods (Figure 6). The researchers write that this could be due to the fact that people in wealthier areas tend to live more insular and self-contained lives, reflecting the individualistic culture of higher social classes. They also valued tranquillity over having good neighbours much more than those who lived in in poorer areas. The researchers ask: could it be that the wealthy seek relief from the disorder and instability in the wider city?
Figure 6. What do you like about your neighbourhood?
Source: HSRC
The impact of COVID-19
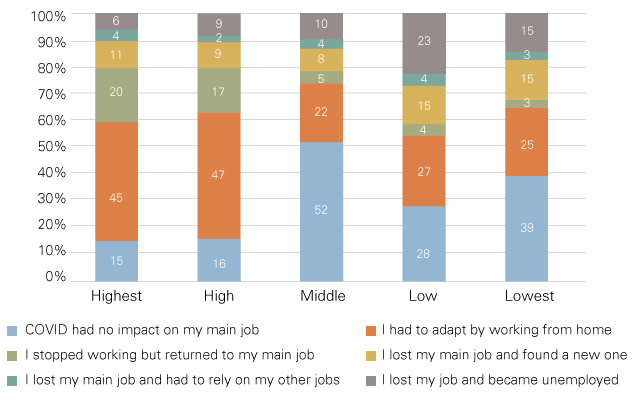
Almost a quarter (23%) of working adults in low-income areas and nearly 15% in the lowest-income areas lost their main jobs and became unemployed due to the COVID-19 pandemic and lockdowns. Another 15% in both areas lost their main jobs but found another. This compounded the existing high rates of unemployment (more than 40%) in these areas. In affluent areas, almost 50% of working adults adapted to the crisis by working from home. Another one in five stopped working temporarily and then returned to their jobs. In poorer areas, only 5% stopped their work temporarily (Figure 7).
Figure 7. Impact of COVID-19 on main job
Source: HSRC
Working adults in middle-income neighbourhoods were least likely to experience such disruption, with 52% reporting no impact on their working lives. The researchers say this may be attributed to the fact that more of these residents were working in essential services like food production, distribution, retail, healthcare and other frontline public services such as refuse collection.
Furthermore, the survey found that nearly half of adults in the low- and lowest-income areas suffered a loss of income, compared with less than a quarter in the middle- and higher-income neighbourhoods. More than half the adults in poorest communities reported difficulties in accessing food, basic supplies and regular medical treatment during the COVID-19 lockdown compared with a quarter to a third of those in affluent areas.
Recommendations
According to the researchers, deep-seated problems like crime can only be resolved by building a common commitment across different groups to narrow the gap between neighbourhoods and to expand the economy in an inclusive manner. It should be easier for people living in townships to access opportunities and facilities in affluent areas. The City of Cape Town should rethink its approach to service delivery and collaborate with communities, civil society organisations and the private sector to empower people to rebuild their troubled communities.
The GCRF Centre
The HSRC and the University of the Witwatersrand, along with research partners from Nankai University in China, the Ifakara Health Institute in Tanzania, the University of Rwanda, the National Institute of Urban Affairs in India, Khulna University in Bangladesh and the University of the Philippines Diliman, are part of the GCRF Centre for Sustainable, Healthy and Learning Cities and Neighbourhoods (SHLC). Administered at Glasgow University, the centre is dedicated to building capacity to improve urban, health and education challenges in neighbourhoods across fast-growing cities in Africa and Asia.
Contacts:
Prof Ivan Turok, distinguished research fellow, Dr Justin Visagie, senior research specialist, and Dr Andreas Scheba, senior research specialist, from the HSRC’s Equitable Education and Economies division
ascheba@hsrc.ac.za