The HSRC’s Prof Ivan Turok and Dr Justin Visagie’s work on spatial planning has been been featured in Gauteng City-Region Observatory’s ‘Map of the Month’. Gleaned from the Spatial Economic Activity Data (SEAD-SA), the map visualises the concentration of formal employment in South African cities.
Introduction
South African cities occupy a tiny fraction of the country’s land area, yet they make up the lion’s share of the economy. This map of the month – produced by researchers at the Human Sciences Research Council and the University of the Free State – explores different ways of depicting the concentration of formal employment in cities.
Choropleth map of formal employment per municipality
Figure 1 is a conventional way of showing the distribution of formal jobs across the country. The spatial units are municipalities. Different coloured shading is used to portray different levels of employment in each area. The information on jobs is based on a new dataset derived from SARS tax data (Note: you can learn more about the economic geography of the country from tax data here: www.spatialtaxdata.org.za). These are formal jobs in the 2021/22 tax year based on full-time equivalents (i.e. adding together all available work opportunities (part-time and full-time) and converting them into the total number of full-time jobs).
View the full piece on the GCRO website here.
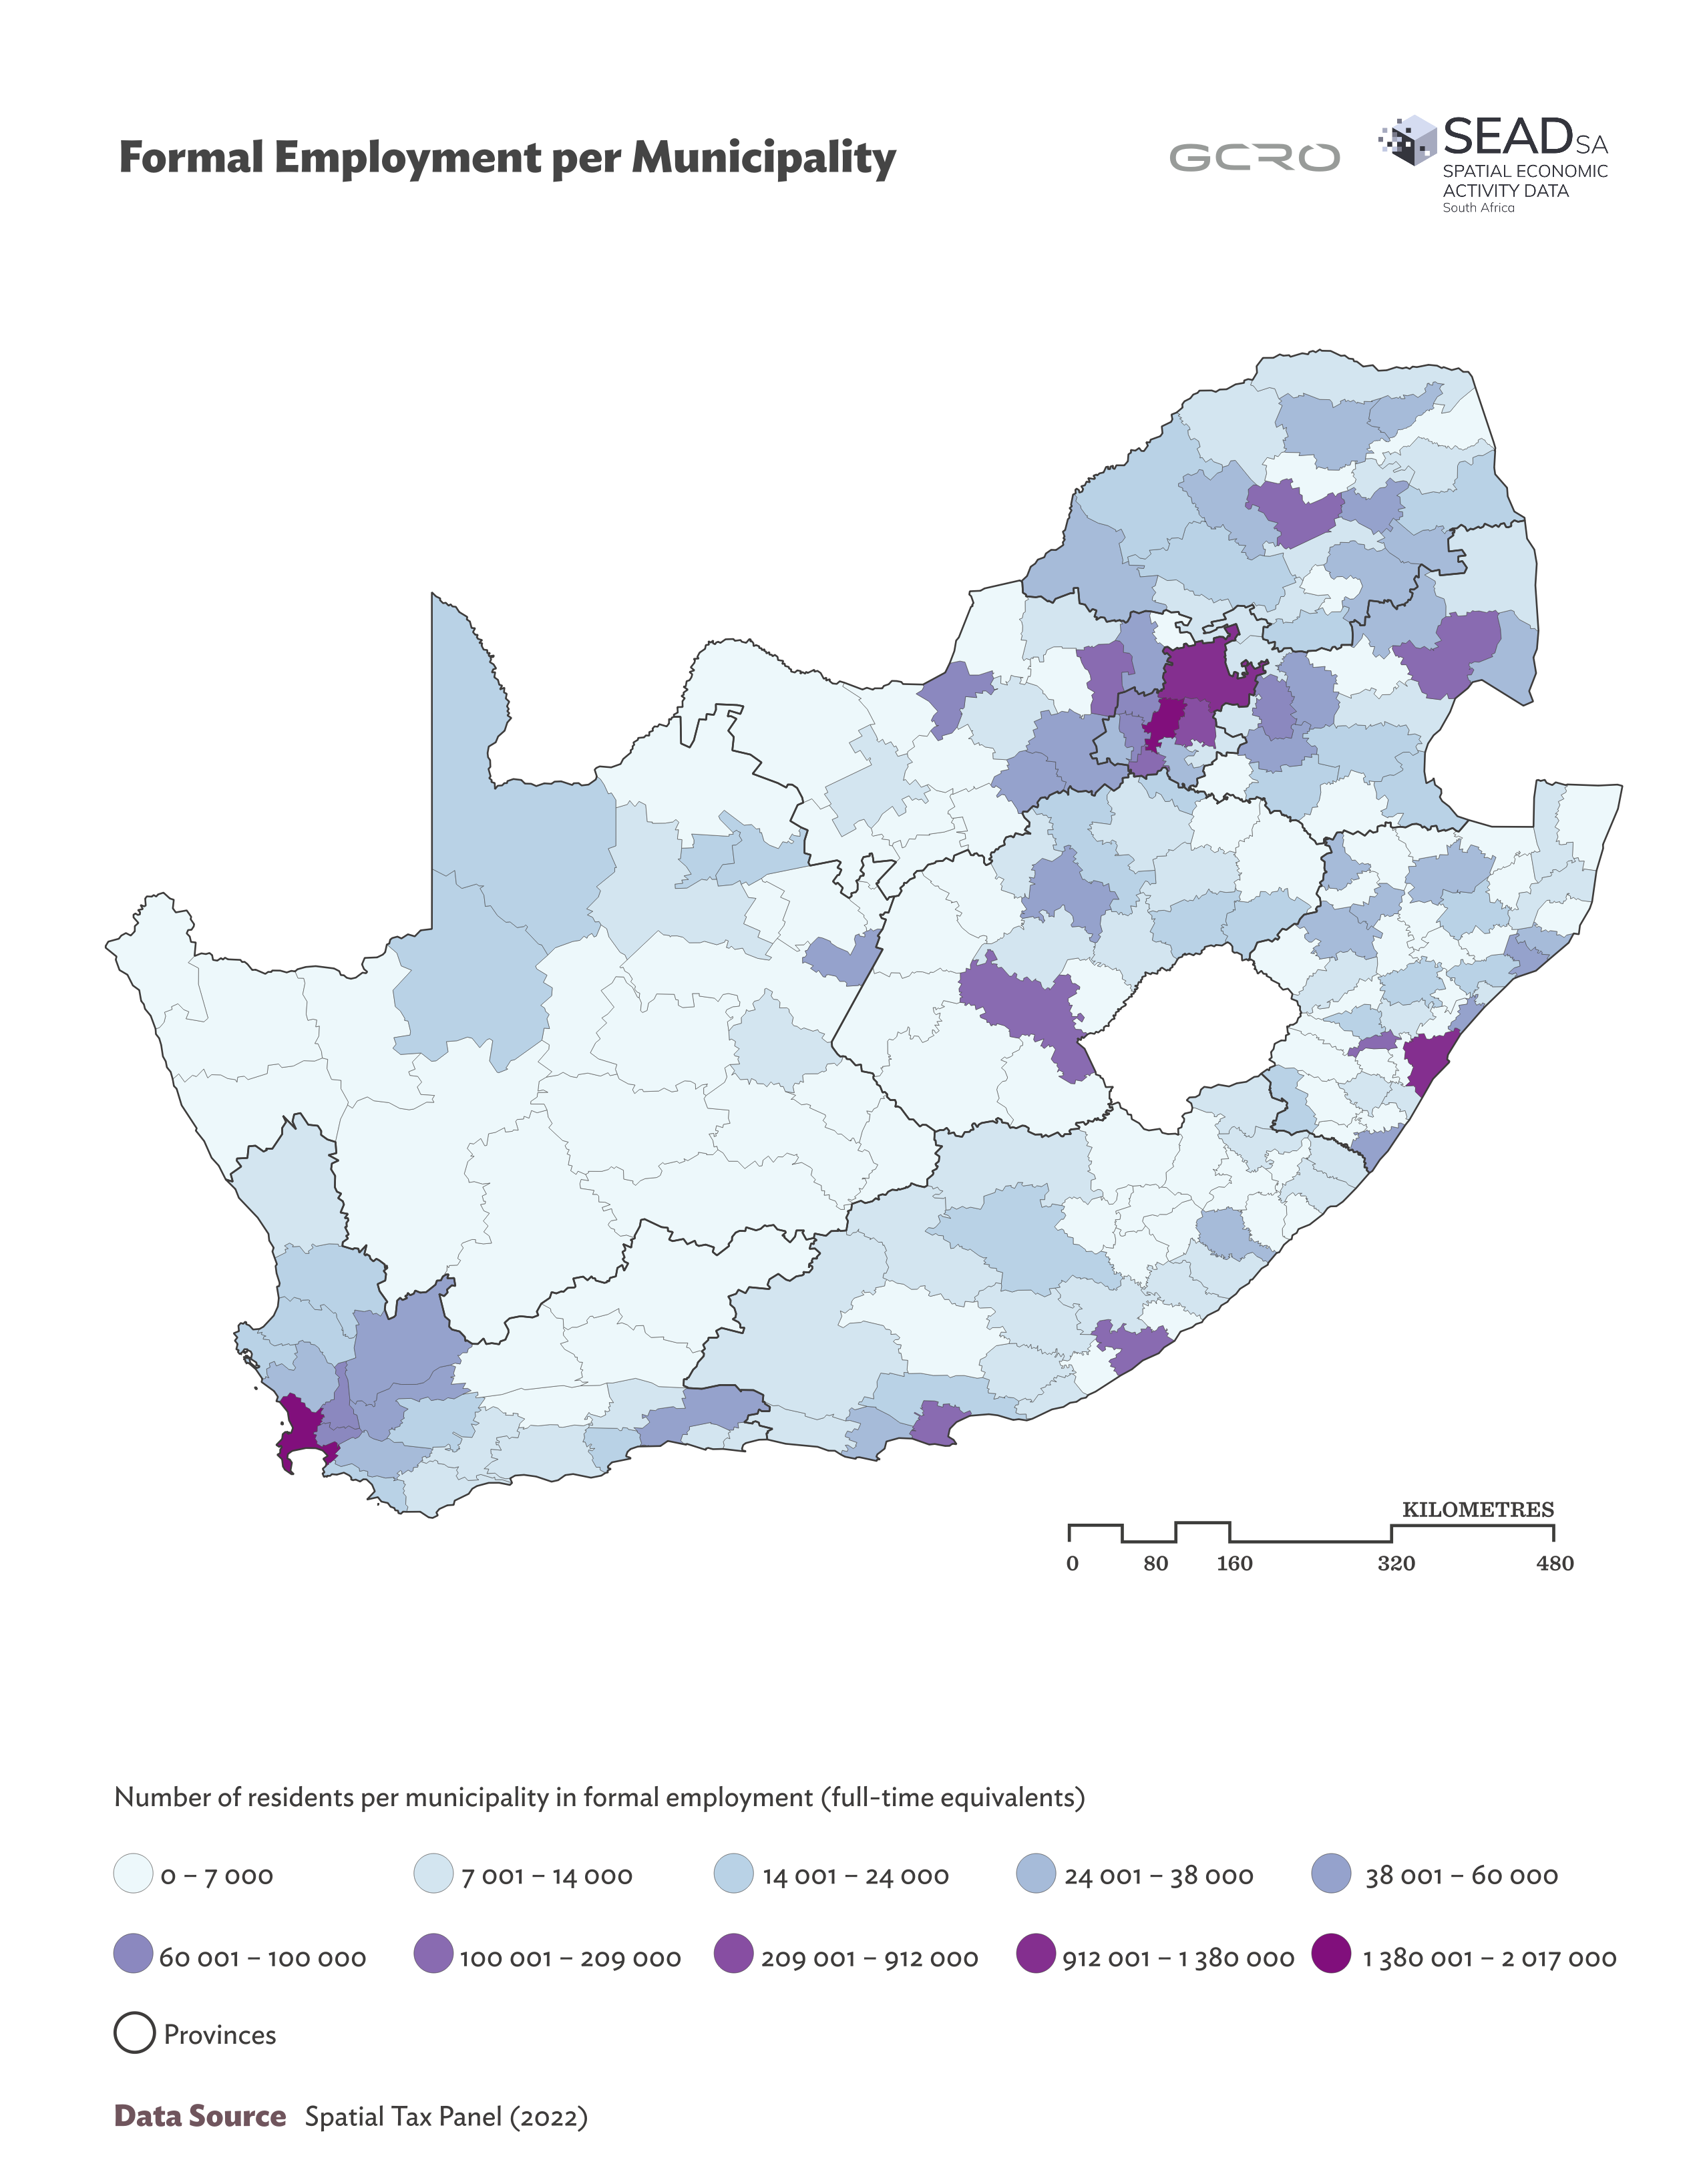
Figure 1: Choropleth map of formal employment per municipality. Source: Spatial Tax Panel, see www.spatialtaxdata.org.za
Learn more about the SEAD-SA project by watching the video below: