South Africa is the most unequal country in the world, with uneven concentrations of wealth and income reflecting the spatial legacy of apartheid. Yet, a lack of granular data about spatial economic activity has hampered accountability and co-ordination in the government about the what and where of local jobs and investment. With the launch of the Spatial Economic Activity Data: South Africa (SEAD-SA) initiative, economic data at the level of neighbourhoods, cities and municipalities are now available to inform policy and planning for the first time. At the launch in June, representatives from academia, the national government, public agencies and city governments gathered to discuss the implications of this ground-breaking initiative. By Andrea Teagle
On 19 June, South Africa reached a milestone in economic planning with the official launch of the Spatial Economic Activity Data: South Africa (SEAD-SA) initiative. Until now, local governments were designing policies without spatial economic data at the level of municipalities, cities and neighbourhoods. Created by mining tax and other administrative records, SEAD-SA is the culmination of a collaboration between the HSRC, the national treasury and others.
The data for the metropolitan municipalities, which were internally released in 2021, have already begun to inform planning at the city level. “Having access to SARS [South African Revenue Service] administrative data has been invaluable for us,” said Siseko Mbandezi of the City of Cape Town at the launch. “It has informed our IDP [Integrated Development Plan] and has been used for special planning and sector support initiatives.” The mayor of eThekwini Municipality, Mxolisi Kaunda, reiterated the sentiment. “SEAD-SA… is an incredible game changer [for the metro],” he said.
The open-access database also covers South Africa’s 205 local municipalities and contains an array of economic indicators for jobs and firms. These can be evaluated by industry/sector, wage levels, gender, youth and age, export status and firm size. Importantly, the database – currently populated with data from 2013/14 to 2021/22 – can be updated with each tax year.
“Our inequalities are fundamentally rooted in space,” explained the HSRC’s Justin Visagie, the principal investigator of the project. Spatial apartheid’s legacy can be traced in the contours of our cities. But he added that cities are also sites of innovation and development – and these positive trends are also visible in spatial data. Policy planning thus requires a spatial lens to address inequalities and to identify opportunities for inclusive growth and development.
In her opening address, HSRC CEO Sarah Mosoetsa said the data will provide insights into important economic questions, such as where jobs are concentrated, which industries are creating them and which are shedding them. She added that such information is important for decision-making at the national, city and municipal levels.
Economic powerhouses
“Almost two-thirds of South Africa’s formal jobs are located in the six largest metros,” said the Minister of Finance Enoch Godongwana during his keynote address at the launch event. This is one of many key policy insights from the data, published in the Cities Economic Outlook 2023 – an HSRC report that accompanied the release of the data (Figure 1). “Metros are the powerhouses of the economy and should be the focus of public spending,” Godongwana said, adding that it is now possible to track the economic outcomes of public sector investments.
Figure 1. Population and employment size, 2019/20
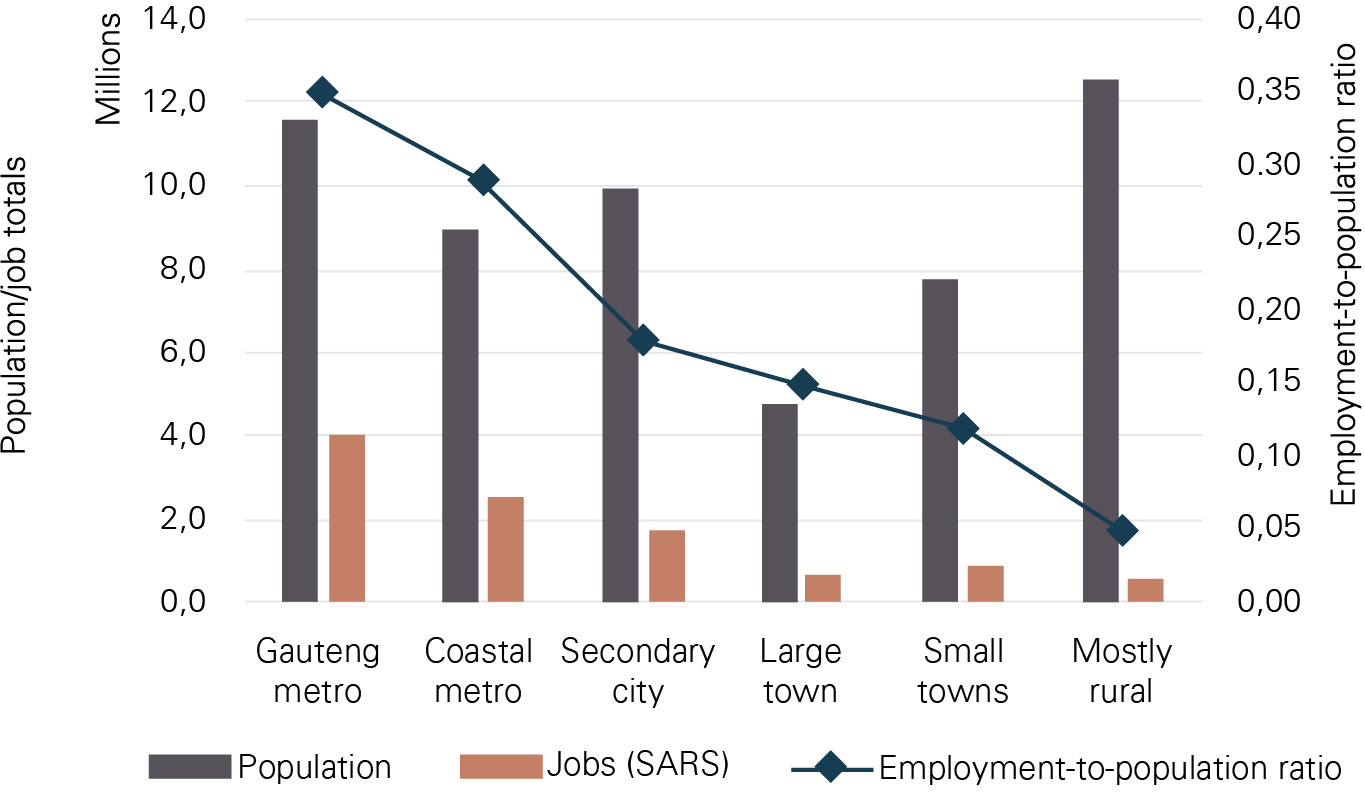
Source: Nell, A. and Visagie, J. 2023. Spatial Tax Panel 2014–2022: version 3
Notes: Population size is for all ages; Gauteng metros include Johannesburg, Ekurhuleni and Tshwane; the coastal metros include Cape Town, eThekwini and Nelson Mandela Bay; and Buffalo City and Mangaung were classified as secondary cities
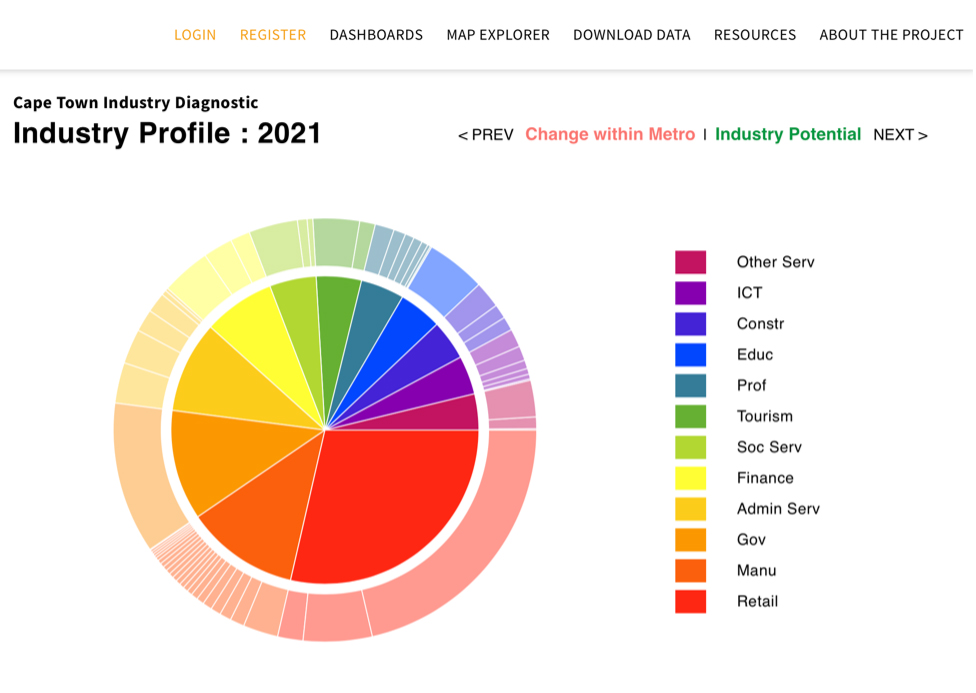
The raw data that form the backbone of SEAD-SA are available in a user-friendly Spatial Tax Web Interface or portal, which is aimed at government officials, investors, businesses and members of the general public (Figure 2). The portal makes it simple and easy to explore and download spatial tax data. For instance, the dashboards feature explores key themes of economic growth, industry diagnostics and equitable economies, including more than 16 interactive charts (Figure 3).
Figure 2. The SEAD-SA web portal where spatial tax data can be explored and downloaded.
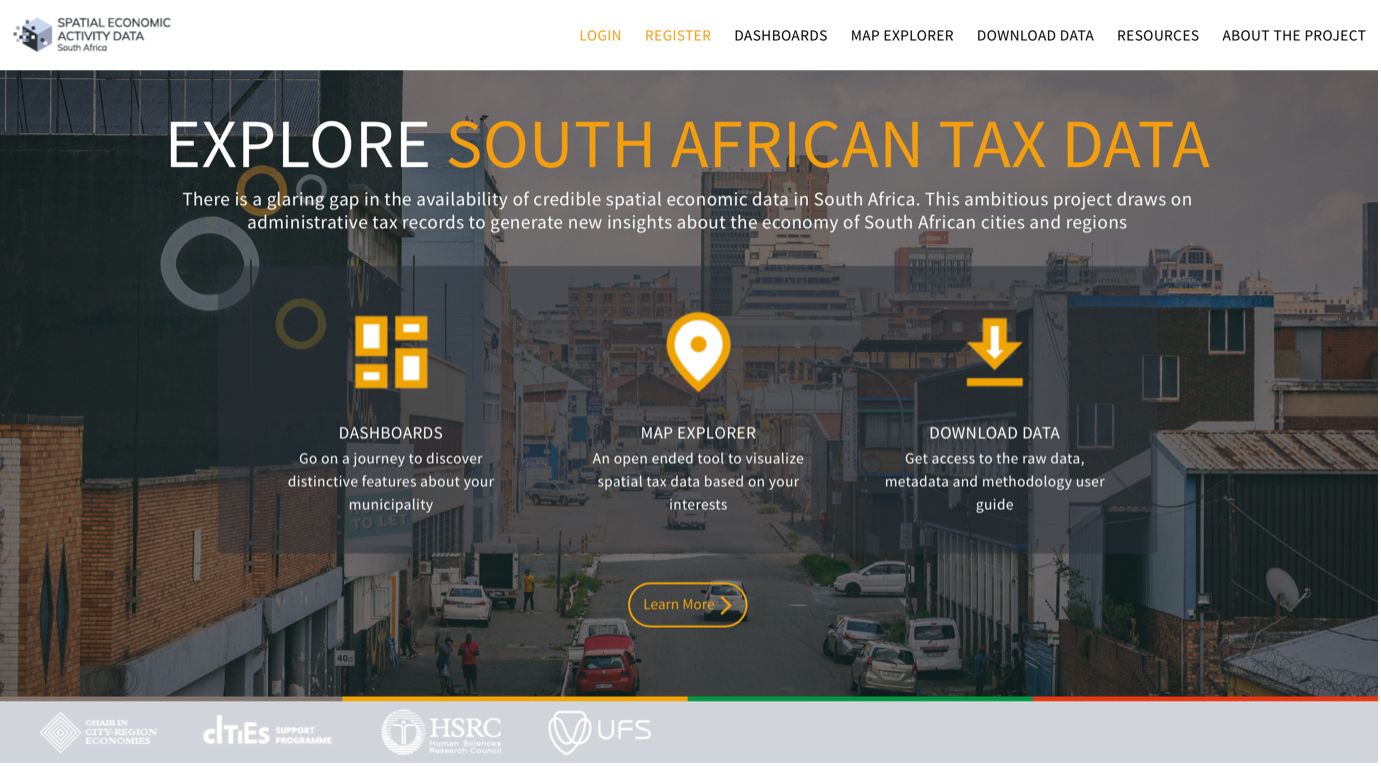
Figure 3. The SEAD-SA dashboards feature more than 16 interactive charts
Visagie presented the portal and showed how the data reveal important insights into the specialisation of each of South Africa’s metros. Each has a particular range of assets, infrastructure, institutions and stakeholders, he said. Acknowledging what is special about each metro allows for a more devolved approach to national industrial and economic policy, which builds on the strengths of every metro. These local features can be decisive in determining economic outcomes.
Data on the concentration of jobs and growth reveal that Johannesburg is a financial stronghold with high-paying jobs driven by this sector. Ekurhuleni’s new jobs are mainly driven by administrative services while eThekwini is a manufacturing and logistics hub. By understanding the particular strengths of our cities, governments can design policy that optimises those complementary strengths. The national economy is hamstrung if only some regions manage to grow, Visagie said.
“If the government doesn’t recognise the diversity of urban economies, [and] it applies standardised national industrial policies to the whole country, the impact is going to be inevitably different,” emphasised the HSRC’s Ivan Turok, a strategic lead in the SEAD-SA initiative.
Municipal officials can use the data to inform targeted public spending and to highlight opportunities for private sector investment and job creation. The City of Cape Town (CoCT) and eThekwini are early adopters of the database, and have begun to incorporate insights from the data into their planning processes.
“Being able to identify even the smallest sub-industries that are experiencing fast job growth means that we can confidently inform investors, through agencies like Westgrow, of areas of comparative advantage in our economy,” said CoCT Councillor Siseko Mbandezi.
Zamo Gwala from the South African Local Government Association (SALGA) underscored that the body of data is only useful insofar as officials have the capacity and willingness to engage with it. He said that the data would help SALGA to accurately compile its Municipal Investment Competitiveness Index, which ranks municipalities in terms of their attractiveness for investors.
Early impact
“Local government is the sphere of government closest to the people,” said the Minister of Cooperative Governance, Thembi Nkadimeng. She indicated that the availability of credible data would allow for more attention to be paid to the performance of our municipalities, regions and local economies.
“Through this innovation, we have been able to demonstrate that citizens no longer have to be passive recipients of government services, but they can play an active role in how these services are delivered…,” said eThekwini Mayor Mxolisi Kaunda.
According to Kaunda, eThekwini Metropolitan Municipality has integrated the economic data across sectors such aseconomic development, human settlement, and audit risk and assurance of trading services. He said the municipality is sharing the body of data on multiple platforms to ensure that officials are actively making use of it.
The City of Cape Town has similarly incorporated the database into its strategic planning. “Knowing where people work, as opposed to where they live, for instance, is critical to the city’s ability to model movement patterns and thereby plan effectively for infrastructure provision,” Mbandezi said. “This is important when thinking about extending bus rapid transit systems like Cape Town’s MyCiTi bus.”
The beginnings of big data
Risenga Maluleke, statistician-general of Statistics South Africa (Stats SA), observed that the integrated data add to what he called “the national system of statistics”, which goes beyond the conventional survey-driven outputs of Stats SA. The integrated database will be a critical management tool for local governments, he said. “But particularly, it’s feeding into what we call big data.”
The database can be expanded to include other spatial data – such as crime data – that users can overlay over the economic data to gain a deeper understanding of South Africa’s economy. “What we know is that issues around local economic development are intertwined with many other issues,” said Kgomotso Tolamo of the South African Cities Network.
Harnessing the full potential of big data in the context of spatial economic data will require more work going forward. “Among other issues that we’ll need to tease out going forward is artificial intelligence to provide insight,” Maluleke said. “Insightful data will give us the information that responds to user needs [and] and user demands.”
SEAD-SA is currently led by the HSRC and the National Treasury: Cities Support Programme and Economic Policy Unit. Other partners include the South African Revenue Service (SARS), the United Nations University World Institute for Development Economics Research (UNU-WIDER), Statistics South Africa, metropolitan municipalities, the Department of Trade, Industry and Competition (the dtic), the South African Local Government Association (SALGA), the South African Cities Network (SACN), the UK’s Foreign, Commonwealth and Development Office, the Swiss State Secretariat for Economic Affairs (SECO) and the University of the Free State (UFS).
Researcher contacts:
Dr Justin Visagie, a senior research specialist in the HSRC’s Equitable Education and Economies division and a senior lecturer at the Department of Economics and Finance, University of the Free State
Prof. Ivan Turok, a distinguished research fellow in the HSRC’s Equitable Education and Economies division, and the DSI/NRF Chair in City-Region Economies at the University of the Free State
Watch the SEAD-SA launch here.
Explore South Africa’s tax data here.