A new, systems dynamics model joins the cohort of COVID-19 models seeking to provide insights into the epidemic in South Africa. Used to capture the 1918 Spanish flu epidemic, systems dynamics models are useful for mapping complex causal relationships over time. At a recent public webinar, the modelling team presented the model for public scrutiny, engagement and improvement. The model’s projections underscore the need for continued vigilance, the researchers said.
The peak of South Africa’s COVID-19 epidemic occurred significantly later than projected by a new COVID-19 model that was created by a multidisciplinary team of researchers. This suggests that government interventions may have delayed the peak period of infections, said the lead researcher, the HSRC’s Dr Shingirirai Mutanga, presenting the model at a recent interactive webinar.
The team applied a systems dynamics model to predict infections, recovery and deaths from the first week of the first recorded COVID-19 case by the National Institute of Communicable Diseases. Systems dynamic models are characterised by feedback loop diagrams, which are useful for visualising multidirectional causal relationships.
“Causal loop diagrams… illustrate how changes in one component cascade in changes in others and back to itself, via feedback loops, potentially affecting the status of the entire system,” write Dr Declan Bradley (Queen’s University Belfast) and colleagues in a recent Lancet article exploring the value of systems thinking in the COVID-19 context.
The SEIR model
The model employed by the HSRC team is called SEIR (‘susceptible’, ‘exposed’, ‘infected’, ‘recovered’) an adaptation of the original SIR (‘susceptible’, ‘infected’, ‘recovered’) model designed by the epidemiologist Anderson Kermack and the biochemist William McKendrick in 1927 to capture the 1918 Spanish flu epidemic. This type of systems model remains the base for many epidemiological models today.
The SEIR model captures how a susceptible population, when exposed to an infectious disease like COVID-19, feeds into a pool of infected individuals. Over time, this pool contracts as some people die and others move into the group of recovered people. As the recovered pool grows, the number of people in the susceptible group diminishes. (Figure 1.) Affecting the flows between the four pools are various factors including intervention measures like personal hygiene, social distancing and the net effect of lockdown on transmission risk.
At the webinar, Mutanga and fellow-speaker Dr Martin Kaggwa, the executive director of the Sam Tambani Research Institute, observed that an important advantage of the model is its logical, user-friendly interface, allowing for input from a multidisciplinary team of researchers. In this case, systems dynamics practitioners, industrial engineers, statisticians and epidemiological specialists contributed to the development of the model, expected to be published by year end.
On trend
The model’s predictions of the trends of infections, recoveries and deaths were comparable to results of other models and the actual recorded cases, Mutanga said, speaking after the webinar. However, he and his team were surprised to find that the model estimates far exceed the actual cases observed, even though in the first 25 days, the epidemic closely followed the projected trajectory (Figure 2). After the interventions were implemented, actual cases deviated from projected cases. (Figure 3.)

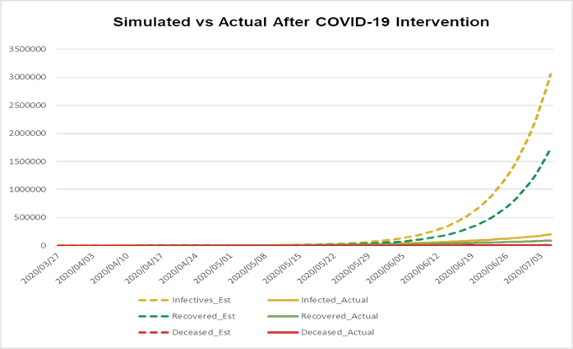
Interestingly, according to the model, the number of new infections was set to peak midway through 2020. “The delay in peak infections was well captured, for the model suggests that we could have had the peak around June had it not been for the government’s risk adjusted strategy on lockdown, and other interventions,” Mutanga said.
Additionally, while the projected deaths were higher than the reported figures, recorded deaths were likely underestimated, the team said. While the official COVID-19 deaths sit at 113 159 (as of 25 August), the Medical Research Council reports that from 6 May–4 August 2020, there were 27 580 more deaths from natural causes than historical data predict for this period. Taking into account the fact that deaths from natural causes are likely to be lower this year ― as lockdown has reduced rates of other infectious diseases ― excess deaths attributable to COVID-19 may be even higher than this, as Nathan Geffen and Alex Welte write in GroundUp.)
The model simulations further suggested that recoveries are more than the actual recorded, Mutanga said, possibly indicating that some people were recovering without hospital intervention.
Inherent limitations of the model include the fact that the population size was considered fixed ― so it did not take into account births and immigration. The model also assumed the population to be homogenous (i.e. everyone is equally susceptible), which is not the case in South Africa.
What can we draw from the findings? “Continuous modelling of epidemics is essential when dealing with uncertainty,” Mutanga said. In addition, the model shows how intervention strategies can affect the simulated scenarios. A historical case in point was the Spanish flu, which after a perceived drop in cases led to a reversal of behaviour change which resulted in a devastating second wave of infections and deaths. “Despite the easing of the lockdown the nation should remain vigilant, for the epidemic is still with us.”
Photo (top): Thomas de LUZE, Unsplash