


Why this matters: Comparing movement volumes and year over year changes reveals where South Africa’s tourism gateways are growing or declining. These gateways link international and regional visitors to the country.
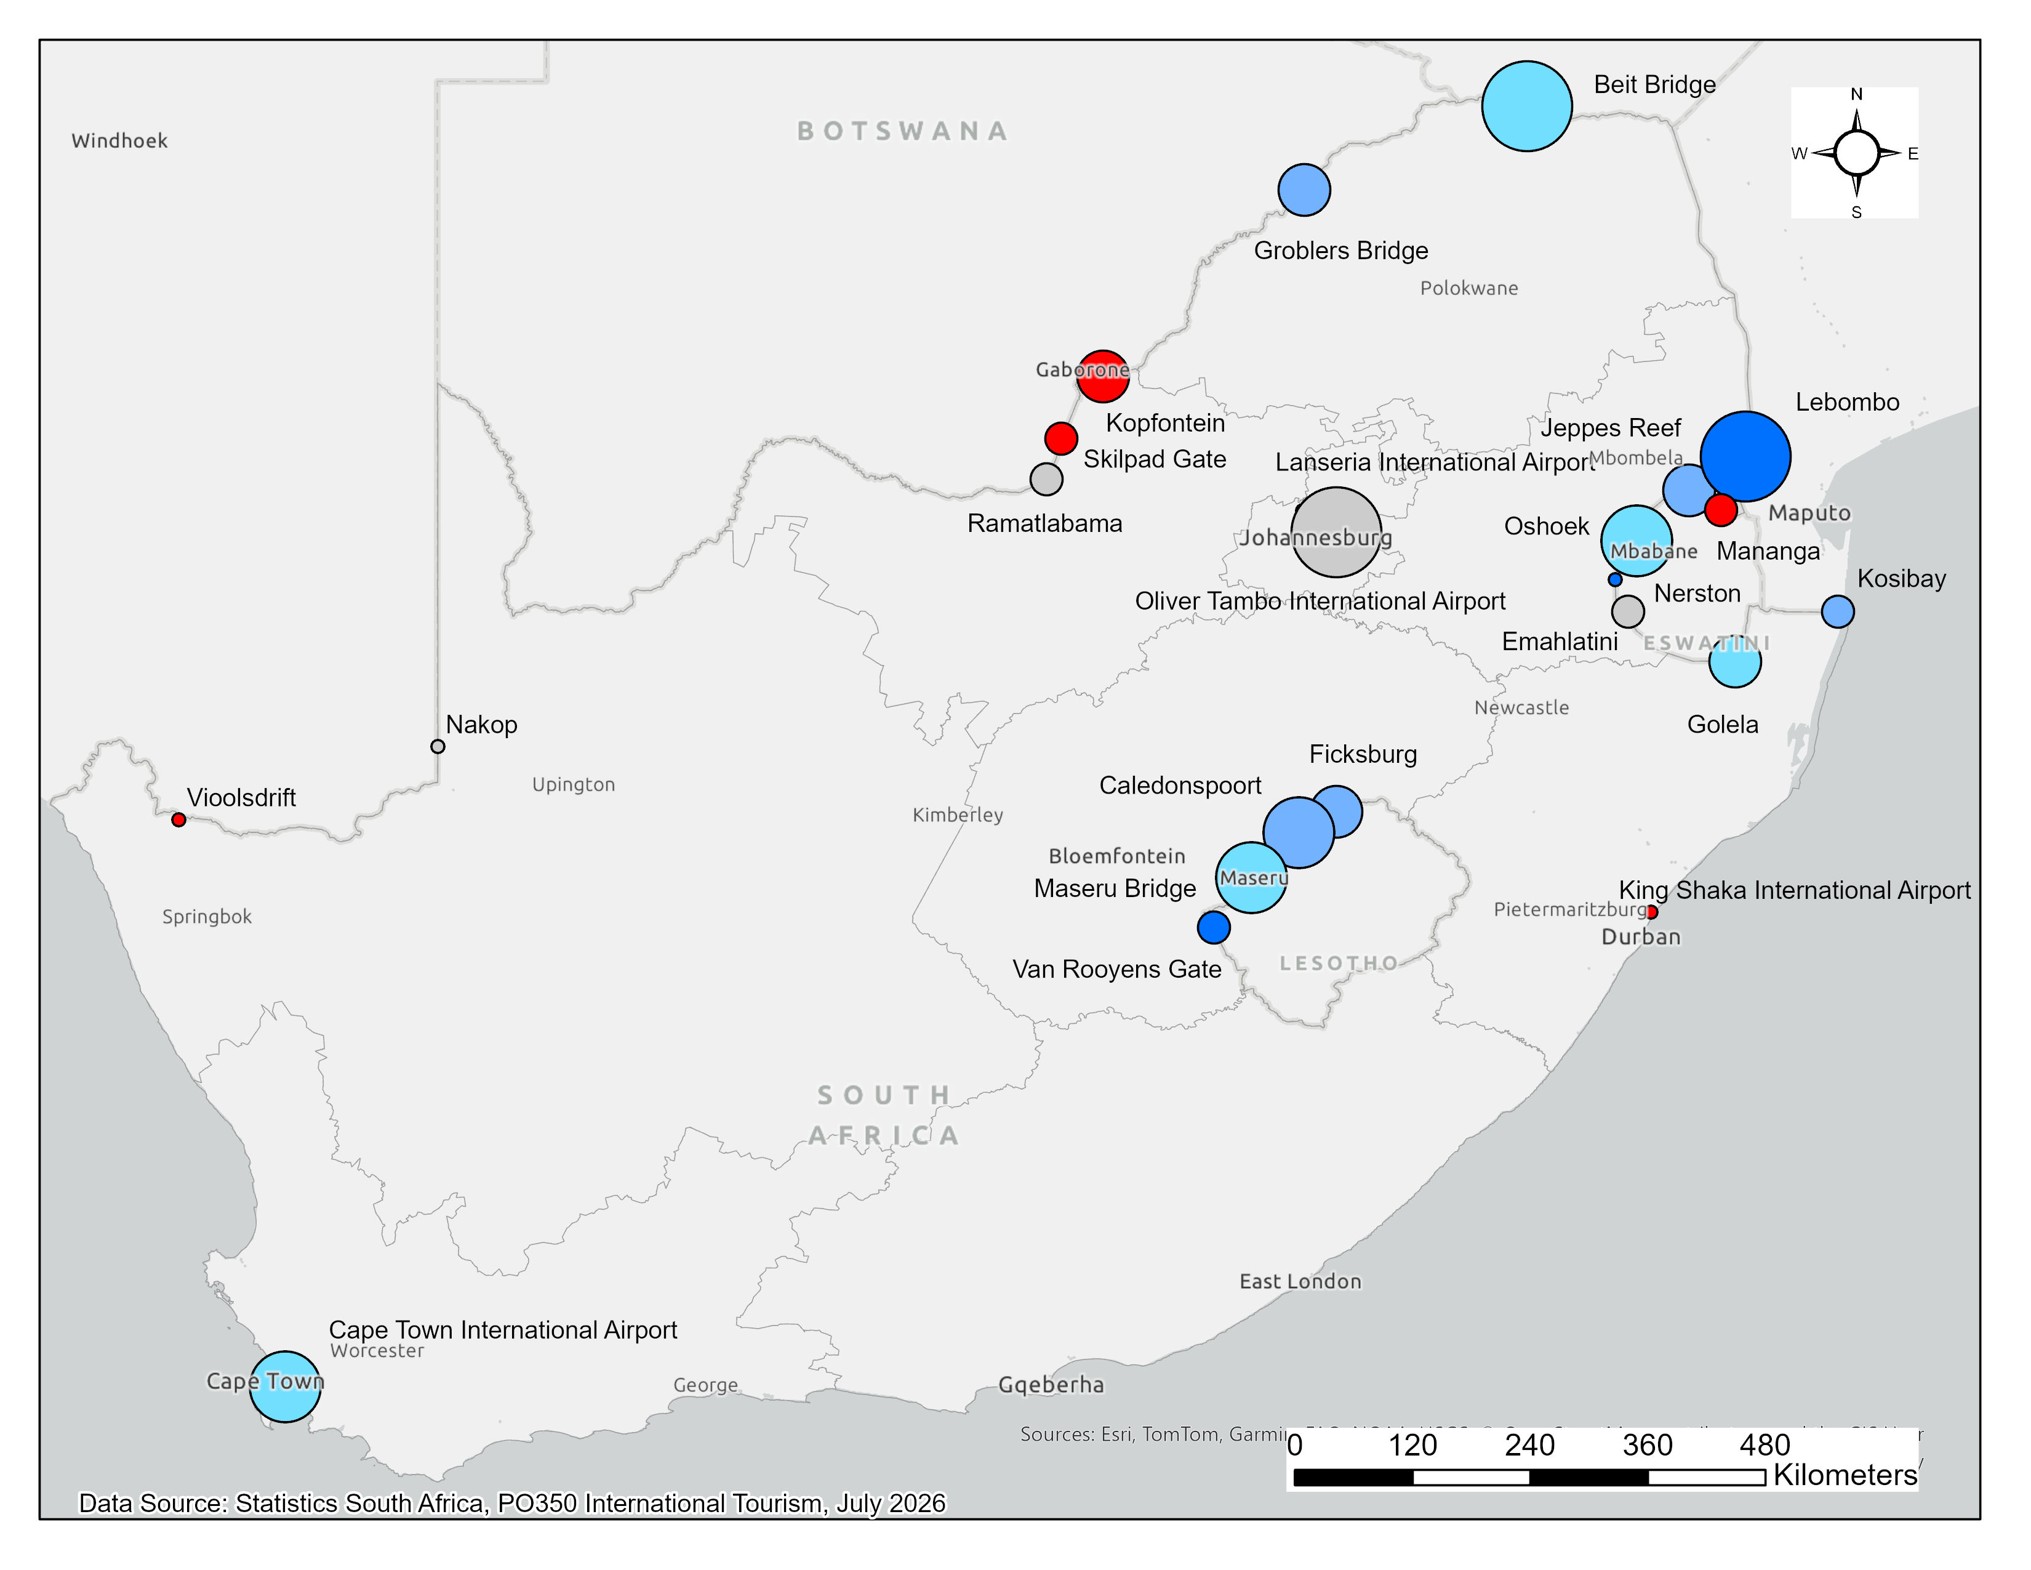
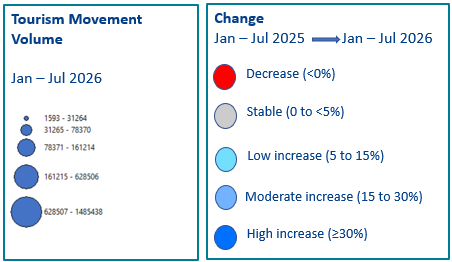
What does the map tell us?
1. Regional land gateways dominate. Land border gateways account for a large share of tourism movements with Lebombo recording the largest increase (344 822, 30.2%).
2. Growth is uneven across gateways. Nerston had the fastest percentage growth (184.8%) but from a very small base.
3. Major gateways carry very different volumes. King Shaka International Airport declined by 33% while Cape Town International Airport increased by 8.4% and OR Tambo International Airport by 4.5%.
Not all South Africa’s gateways are experiencing an equal increase in tourism. The trend suggests that regional land corridors will play a bigger role in the development of border capacity, visitor services, transport connections and destination investment in addition to the continued expansion of major international air gateways.
Moeti, T. & Mokhele, T. (2026). Where are tourists entering South Africa and how are these gateways changing?. Spatial Insights: Edition 21. Pretoria: eResearch Knowledge Unit, Human Sciences Research Council. DOI: https://doi.org/10.14749/34014387
